


In the past few years, machine learning (ML) has gone from a discipline restricted to data scientists and engineers to the mainstream of business and analytics. With advancements in automated machine learning (AutoML) and collaborative AI and machine learning platforms (like Dataiku), the use of data — including for predictive modeling — across people of all different job types is on the rise.
This article (the first of three parts) is designed as a means of support and reference for beginner practitioners who want to get started with building their first predictive ML model. Here in part one, we dive into defining the goal and preparing the dataset for ML, including data cleaning, feature selection, and feature handling and engineering.
Prerequisite: Key Machine Learning Concepts and Main Considerations
This section provides a crash-course refresher on some of the basic machine learning concepts as a primer to building a predictive model.
AI vs. Machine Learning vs. Deep Learning
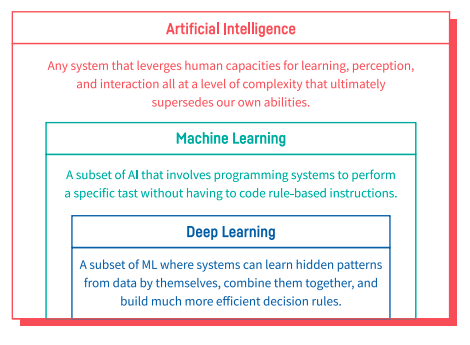
Before getting into ML, let’s take a step back and discuss artificial intelligence (AI) more broadly. AI is an umbrella term for any computer program that does something smart that we previously thought only humans could do. This can even include something as simple as a computer program that uses a set of predefined rules to play checkers, although when we talk about AI today, we are usually referring to more advanced applications.
Specifically, we're usually talking about machine learning, which means teaching a machine to learn from experience without explicitly programming it to do so. Usually the “thing” machine learning is predicting is not explicitly stated in data (for example, predicting whether or not someone will default on their loan, what kind of music people will like based on songs they’ve listened to, etc.).
Deep learning, another hot topic, is a subset of machine learning and has further enhanced the AI boom of the last 10 years. In a nutshell, deep learning is an advanced type of ML that can handle complex tasks like image and sound recognition.
AI vs. ML vs. DL
Machine Learning Model, Machine Learning Algorithm… What’s the Difference?
When reading about ML, you have probably seen the expressions “machine learning model” and “machine learning algorithm” used quasi-interchangeably, which can lead to some confusion.
Put simply, the difference between a model and algorithm is as follows:
- An algorithm is a set of rules to follow in a certain order to solve a problem.
- A model is a computation or a formula that you build by using the algorithm.
An ML model will take your data as input, apply the rules of the algorithm(s) used, and produce an output model as result.
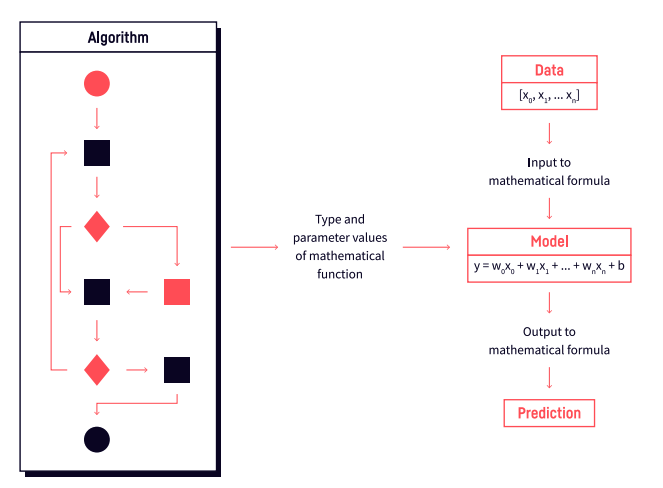
A visual representation of algorithms vs. models
Types of Machine Learning
Machine learning can be divided into two key subcategories:
- Supervised ML, which uses a set of input variables to predict the value of an output variable. It uses previous values to predict new values.
- Unsupervised ML, which infers patterns from an unlabeled dataset. Here, you aren’t trying to predict anything, you’re just trying to understand patterns and groupings in the data.
Supervised vs. unsupervised learning

This article focuses on supervised machine learning — we will look at historical data to train a model to learn the relationships between features, or variables, and a target, the thing we’re trying to predict. This way, when new data comes in, we can use the feature values to make a good prediction of the target, whose value we do not yet know.
Supervised learning can be further split into regression (predicting numerical values) and classification (predicting categorical values). Some algorithms can only be used for regression, others only for classification, and many for both.
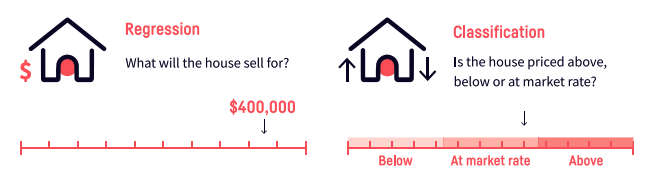
Regression vs. classification problems
For an overview of top prediction algorithms, check out this blog.
Now that you have brushed up on some of the key machine learning concepts, let’s dive into the fundamental steps of building a predictive machine learning model. The following sections will go through each stage one by one, including key considerations for each stage.
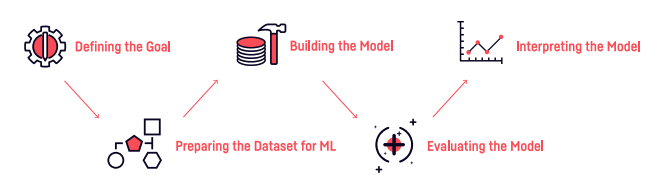
Key stages of building a machine learning model
1. Defining the Goal
Defining the business objective of a machine learning project as concretely as possible is key to ensuring its success, and it’s the first step of any sound data project. In a business setting, motivating the different actors and obtaining all the resources necessary to get models from design to production requires a project that addresses a clear organizational need.
If you’re working on a personal project or playing around with a dataset or an API, this step may seem irrelevant. It’s not — simply downloading a cool open dataset is not enough. In order to have motivation, direction, and purpose to execute and build a machine learning model from start to finish, you have to identify a clear objective for what you want to do with the data, the model, and how it’s going to improve your current processes or performance at a given task (or unlock new solutions to a given problem that you couldn’t address before).
When it comes to identifying a business problem for your first predictive machine learning model, you could start by looking at the different types of prediction and thinking about what exactly it is that you would like to predict. As seen in the previous section, there are two main types of supervised machine learning:
- Classification — Do you want to predict whether something is one thing or another?
Such as whether a customer will churn or not churn? Or whether a patient has heart disease or not? Note, there can be more than two options, or more than two “classes” that what you’re trying to predict can fall into. Two classes is called binary classification, more than two classes is called multi-class classification. Multi-label is when an item can belong to more than one class.
- Regression — Do you want to predict a specific number of something? Such as how much a house will sell for? Or how many customers will visit your site next month?
Throughout this article, we will be using a fictional T-shirt company called “Haiku T-shirts” as an example. Let’s say that for our T-shirt business, one crucial pain point is predicting sales and revenue — that is, as a company, we need to be able to anticipate how many T-shirts we’ll sell each month and how much revenue we can expect to generate. This is critical for planning and business forecasts as well as for stock optimization.
As this is our first predictive ML model and we want to keep things fairly simple, we will narrow down the business question even further and focus on predicting how much revenue new customers will generate this month.
2. Preparing the Dataset for Machine Learning
Preparing data for machine learning can take up to 80% of the time of an entire data project. In other words, making sure data is consistent, clean, and usable overall is no small undertaking. However, having clean data is critical when building machine learning models — garbage in, garbage out, as the saying goes. This section will cover the basics, from finding the right data to preliminary analysis and exploration of datasets to feature discovery.
Getting the Data
With a goal in mind, it’s time to start looking for data: the second phase of building a model. Mixing and merging data from many different data sources can take a data project to the next level. For example, our fictional T-shirt company trying to predict how much revenue new customers will generate certainly requires internal data (like sales and CRM data) but it could also benefit from external data sources such as economical data (are people buying a lot of goods in general?) and data that represents fashion trends.
There are a few ways to get usable data:
- Connect to a database: Ask data or IT teams for the data that’s available.
- Use APIs: Application Programming Interfaces (APIs) allow two applications to talk to each other, and they can be used to access data from tools like SalesForce, Pipedrive, and a host of other applications on the web or that your organization might be using. If you’re not an expert coder, Dataiku Plugins provide lots of possibilities to bring in external data.
- Look for open data: The web is full of datasets to enrich what you already have with additional information. For example, census data could help add average revenue for the district where a user lives, or OpenStreetMap can provide the number of coffee shops on a given street. A lot of countries have open data platforms (like data.gov in the United States). If you're working on a fun project outside of work, these open data sets are also an incredible resource.
If you’re following along with the Dataiku T-shirt example, you’ll see that this project uses a few simple datasets: historical CRM data combined with data from users’ interactions on the company website.
Analyze, Explore, Clean
Before building a model, it is good practice to carefully understand the dataset(s) at hand. Spending time properly analyzing, exploring, and cleaning data at this stage not only can ensure better results, but it also helps avoid serious issues (e.g., using inherently biased or problematic data that can easily lead to biased or otherwise problematic models).
Start digging to see what data you’re dealing with and ask questions to business people, the IT team, or other groups to understand what all variables mean. From there, you’ve probably noticed that even though you have a country feature, for instance, you’ve got different spellings, or even missing data. It’s time to look at every one of your columns to make sure the data is homogeneous and clean.
Keep an eye out for data quality issues, such as missing values or inconsistent data — too many missing or invalid values mean that those variables won’t have any predictive power for your model. Plus, many machine learning algorithms are not able to handle rows with missing data. Depending on the use case, we could impute (or assign) the missing values with a constant, like zero, or with the median or mean of the column. In other cases, we might choose to drop rows with missing values entirely.
Missing values are an issue for categorical variables as well. . For example, in the T-shirt project, we could treat the missing values as an additional “Missing” category, or we could impute the most common category of the existing ones. For instance, if the most common T-shirt category in our dataset is White M Female T-shirts, we may want to impute this to fill the missing rows in our T-shirt type category. Another option would be to entirely drop rows with missing values.
Feature Selection
After exploring and cleaning datasets, the next step is selecting the features you’ll use to train your model. Also known as an independent variable or a predictor variable, a feature is an observable quantity, recorded and used by a prediction model — in structured datasets, features appear as columns. Examples of features from the Dataiku T-shirt sample project include “pages visited,” “country,” etc. Note that it’s also possible to engineer features by combining them or adding new information to them.
The main reasons behind using feature selection are that it:
- Reduces complexity. Including only the most relevant features means less complexity, which is good not only for model explainability, but also for training speed. Less complexity can also mean better accuracy, as irrelevant features introduce noise.
- Reduces overfitting. Overfitting is when a model has learned too much detail or noise in the training data that won’t necessarily exist in unseen data. In this case, the model will appear to perform well on the training data but will perform poorly on unseen data. This is often referred to as the model not generalizing well — more on this later.
Some features can negatively impact model performance, so you’ll want to identify and remove them. Common feature selection methods include:
- Statistical tests, which can be used to select those features that have the strongest relationship with the output variable. For example, univariate analysis is useful for exploring a dataset one variable at a time. This kind of analysis does not consider relationships between two or more variables in your dataset. Rather, the goal here is to describe and summarize the dataset using a single variable. On the other hand, bivariate analysis is useful for analyzing two variables to determine any existing relationship between them.
- Correlation matrices are useful for showing the correlation coefficients (or degree of relationship) between numeric variables. Correlation states how the features are related to each other or the target variable. Correlation can be positive (increase in one value of feature increases the value of the target variable) or negative (increase in one value of feature decreases the value of the target variable). Correlation matrices allow you to view a visual table of the pairwise correlations for multiple variables in your dataset, but you can also use a heatmap, which makes it easy to identify which features are most related to the target variable. If two features are highly correlated (either positively or negatively) with each other, you might want to consider removing one.
Feature Handling and Engineering
Feature handling is about making certain transformations to features that would allow them to be better used and positively impact the performance of your model. Assuming that you have clean data, feature handling and engineering is where you can make the biggest impact when creating an ML model — so it’s pretty important!
A feature’s variable type determines the feature handling options during machine learning:
- Numerical variables take values that can be added, subtracted, multiplied, etc. There are times when it may be useful to treat a numerical variable with a limited number of values as categorical. For instance, if you have two product categories that are just labeled as “1” and “2,” they would normally be processed as numerical variables, but it might make more sense to treat them as classes.
- Categorical variables take one of an enumerated list values. The goal of categorical feature handling is to encode the values of a categorical variable so that they can be treated as numeric.
- Text variables are arbitrary blocks of text. If a text variable takes a limited number of values (for instance, “white T-shirt M,” “black T-shirt S,” etc.), it may be useful to treat it as categorical.
Feature engineering relates to building new features from the existing dataset or transforming existing features into more meaningful representations — take, for example, raw dates. Raw dates are not well understood by machine learning models, so a good strategy would be to parse those dates, or convert them into numerical features to preserve their ordinal relationship.
Another example of when feature engineering might be necessary is if there are large absolute differences between values — in this case, we might want to apply a rescaling technique. Feature scaling is a method used to normalize the range between the values of numerical features. Why? Because variables that are measured at different scales do not contribute equally to the model fitting, and they might end up creating a bias.
Note that some data science, machine learning, and AI platforms (like Dataiku) automatically add normalization, though it’s still important to understand the basics of what’s happening. For example, one of the most common rescaling methods is min-max rescaling (also known as min-max scaling or min-max normalization), which is the simplest method. It consists of scaling the data to a fixed range — usually 0 to 1. Having this bounded range means smaller standard deviations, which can suppress the effect of outliers.
Featuring engineering looks a little different for categorical variables — for example, one transformation involves encoding categorical variables as numbers so that they can be understood by the machine learning algorithm. Dummy-encoding (vectorization) creates a vector of 0/1 flags of length equal to the number of categories in the categorical variable. You can choose to drop one of the dummies so that they are not linearly dependent, or — if you’re using it — let Dataiku decide (in which case the least frequently occurring category is dropped). There is a limit on the number of dummies, which can be based on a maximum number of categories, the cumulative proportion of rows accounted for by the most popular rows, or a minimum number of samples per category. In our T-shirt example, we could apply dummy encoding so that hats and shoes are encoded as numbers.
Be sure to stay tuned for part two of this article where we dive into actually building the model and evaluating it!